Delivering an engaging User Experience (UX) is a critical aspect of any app, website, or product; and UX Design plays a key role in ensuring that. The layout within a chatting app, the structure of an e-commerce website, or even the keys and widgets in a smartwatch all come under the umbrella of UX design. According to a report from Toptal, 90% of users will not return to a website if it has bad UX. While bad UX is a subjective term, over 70% of web designers interviewed by HubSpot say that non-intuitive navigation, poorly structured content and outdated design elements are some of the main reasons for a user to abandon their interactions within a website. This blog will explore the many aspects of measuring UX design and its impact on the customer journey.
Is the Performance of UX Design Measurable?
A restaurant measures its success with an increase in footfall and repeat customers. On the other hand, an app developer can determine the performance of UX design with a straightforward goal – usability. When the user cannot accomplish what they set out to do with the app – send a text or post a picture, they tend to move away from the product or service. According to Uteri, 70% of online businesses fail due to bad UX design. While the goal is straightforward, several metrics must be considered to measure the success of UX design.
UX Design Metrics
Measuring the impact of UX design helps businesses understand if they are on the path to success and growth. By measuring UX performance, UX designers and product managers can better understand how the offering is perceived, used, and understood. Teams can modify their UX strategy if these do not align with the standards set. Simply put, measuring UX impact helps designers make informed decisions. To calculate the impact of UX design, there are several metrics available. These metrics or parameters help understand users’ engagement with the products and services. UX metrics can be attitudinal or behavioral.
Attitudinal UX Metrics focus on what people say or how they feel about the product. This is done in the form of Customer Satisfaction score [CSAT], Net Promoter score [NPS], felt speed or system speed, and System Usability Scale (SUS). While CSAT helps measure user satisfaction within a customer journey, NPS is used to measure long-term satisfaction or brand loyalty. CSAT is a versatile tool that can be determined by asking different types of questions in situations where immediate feedback is needed. On the other hand, NPS is considered a more reliable and accurate gauge of customer satisfaction as it focuses on long-term customer loyalty and happiness.
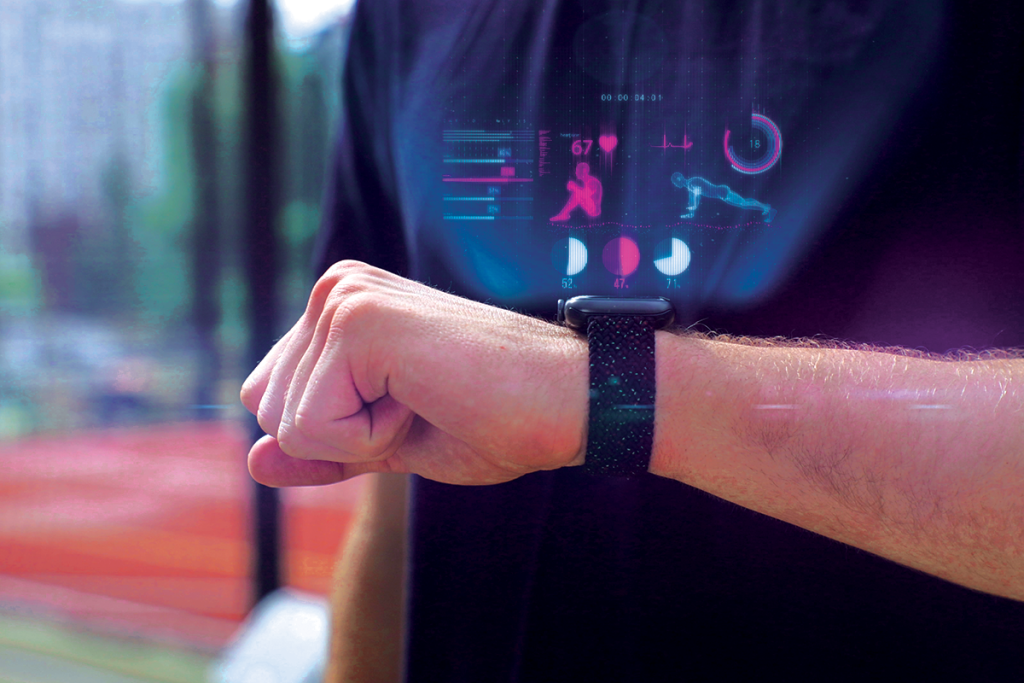
Behavioral UX Metrics study the user’s actions and interactions with the product. Some of the common values measured include task success rate, task on time, and measured speed. Task success rate is used to measure the number of users who have successfully completed an action in the app or website within a user interface. Task on time is a good metric to use to measure the duration to complete a particular action. Measured speed focuses on load time of the website.
Measuring the Impact of UX
User experience is one of the critical driving factors for the success of the application. To that end, several parameters can be used to determine the usability and response to a UX design and if it meets the needs of its audience. Some of the commonly used tools include user testing, online surveys, session analysis, analytics, web accessibility, A/B testing, and multivariate testing.
Considered one of the highly effective methods of measure, user testing is perfect for targeting specific user groups and using their response to get first-hand feedback on the application. This method works best when used during the early stage of the design process. Another method of understanding UX impact is online surveys. Considered an inexpensive form of data capture, companies must use a large sample size to gather feedback and turn them into areas of improvement.
When a business wants to understand the user journey, session analysis, and A/B testing work best. Session analysis is used to understand a user’s path by studying several user journeys within the website or application. A/B testing, on the other hand, is used to isolate and assess various elements of the website or application to identify what works and which elements interfere with user movements.
In UX, web accessibility is a measure to gauge how a website appeals to different user groups. UX analytics is used as a tool to measure user interaction and behavior with respect to the overall design layout. Poor design can affect user behavior and fail to meet user expectations. Analytics allows designers to test design ideas, validate user behavior, and understand user expectations better.
Correlation between KPI and UX Design
Sometimes businesses consider Key Performance Indicators (KPIs) to be their UX metrics as both help determine the success of a project or initiative. Although these concepts seem to overlap, UX metrics and KPIs have several key differences. Simply put, the UX metric is a subset of KPI because it helps the business achieve its larger business goal. UX metrics are only used to measure a user’s experience while using a product or service over time. On the other hand, KPIs are set for every wing of the business and tied to overall business goals. KPIs are used to measure sales, customer retention, and revenue growth. KPIs include conversion rate, drop-off rate, and single usability metric (SUM).
Conversion rate refers to the number of visitors who have completed the task in a webpage or application. This can be a purchase, sign up or any other action that the page has been intended to attract. The opposite of conversion rate is drop-off rate that shows how many people have left the page without finishing the action. This can be incomplete forms, abandoned shopping carts, or even unfinished surveys. SUM is used to break down design errors and come up with a plan to avoid or iterate them thus improving overall usability of the website. These KPIs can help give insights to designers on how their design is performing and what improvements are needed.
Business Impact
Research by McKinsey shows that a good UX design has the potential to create a better user experience and improve customer satisfaction and business growth. UX design has a major role to play in improving the functionality of the application or software, enabling businesses to declutter and select the right functionality while boosting product usability. In other words, a good UX design has long-term benefits that can directly influence the business. As technology evolves, businesses must keep up with the customer’s expectations. Unless users have a positive experience with the product or service, a business cannot grow as expected or hold onto the customers on hand.
UNBOX is a UX practice at GS Lab | GAVS, where we design world-class yet practical digital experiences for our customers. In numerous engagements, we have been involved in various stages of the product development lifecycle, including PoCs and MVPs. Our experience in UX allows us to navigate vast domains and different customer segments easily. Unboxing user experience aspects at an early stage of the product surely does reap benefits later.
You can find more information on our services here.